
CDOM Measurement Systems
Measuring CDOM with a Fiber Optic Liquid Waveguide Capillary Cell
One's imagination is the limit with practical uses of WPI's Liquid Wavelength Capillary Cells(LWCC), also referred to in the fiber optic spectroscopy community as a Long Pathlength Flow Cell. This fiber optic sampling accessory for absorbance measurements combines increased optical pathlengths with small sample volumes making them ideal for water analysis such as CDOM.
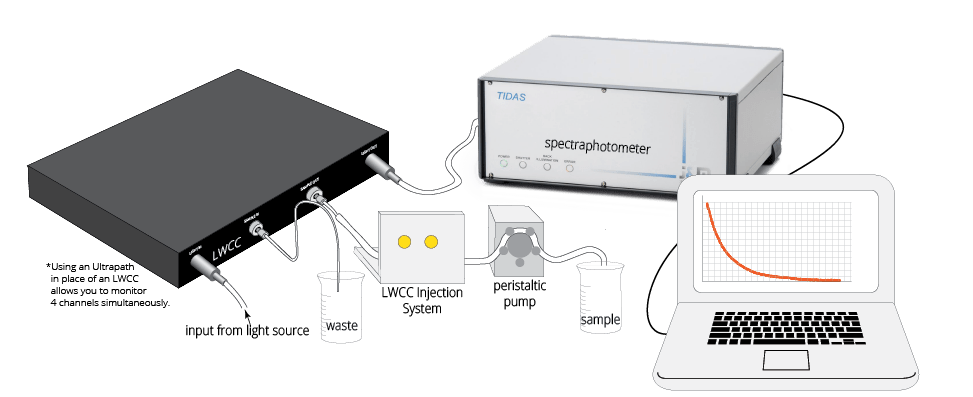
Two optical fibers couple to this sampling accessory one to send light to the sample cell and the second to send light to a spectrometer. The length of the fiber optic cable can vary allowing investigators to either spot test CDOM in the lab from collected water samples or continuously monitor CDOM of a body of water under investigation with this sampling accessory coupled to a fiber optic spectrometer and source.
What is CDOM?
The optically measurable component of Colored Dissolved Organic Matter. It occurs naturally in water systems and is derived from organic tannins.
Why is the study of CDOM levels important?
To protect, preserve, and secure our water systems, a limited natural resource, against harmful effects such as human and geographical influences. Studies help researchers derive best practices to remedy abnormal levels of CDOM from numerous activities examples include logging, effluent discharge,abnormal weather events and wetland drainage all which significantly impact the quality and biological activity in aquatic systems.
Why use WPI's LWCC?
LWCCs are fiber optic flow cells that combine an increased optical pathlength with small sample volumes.
- Improved dynamic range for broader range of absorbance measurements
- Improved sensitivity of measurements
- Measurements can be made using small sample volumes
- Compact, portable system for real time measurement abroad ship
- Proven technology for water analysis projects with ~100+ publications
KEY FEATURES
- 10–500 cm pathlength (depending on LWCC model)
- 2.4 μL to about 3 mL internal volume (depending on LWCC model)
- 220–720 nm wavelength range
- Proven technology with 100's of relevant publications
- 5–500 fold sensitivity improvement in comparison to 1 cm cuvettes
- 0.55 mm ID for low sample volume sampling (3000 series LWCC)
- 1 mm ID for unfiltered liquid samples (5000 series LWCC)
- SMA 905 fiber optic connections

Benefits
- Improved dynamic range for broader range of absorbance measurements
- Improved sensitivity of measurement
- Detect lower concentrations of solutes
- Measurements can be made using smaller sample volumes
- Compact, portable system for real time measurement on board a ship
Determining LWCC pathlength
Selecting the proper equipment is imperative when setting up your system. We have a team on call with local application sales engineers who can visit to access challenges and then recommend an LWCC accessory or solution based on the specifics of your project. The following is guide:
- Select the LWCC pathlength based on the desired absorption range.
- Fresh water with absorption range > 4.0 m-1
- Coastal-ocean waters with absorption range 1.0–4.0 -1
- Open ocean water with absorption range < 1.0 m-1
- Select the usable internal volume.
Now, you can select components to complete your CDOM analysis system, depending on the selected LWCC.
The effective pathlength of WPI’s LWCC is defined as the equivalent pathlength of the cell, if it is assumed that the LWCC follows strictly the Beer-Lambert law: A = ε x c x L, where A is measured absorbance, ε the molar extinction coefficient, c is concentration and L the effective pathlength.
Typically, the longer LWCC pathlength is used to increase the sensitivity when the maximal absorbance values are supposed to be <0.1 AU (Absorbance Unit). Inversely, when absorbance measurements are above 1.4 AU, the LWCC pathlength should be decreased to ensure that measurements still remain within the linear range of the LWCC detection system.
Absorbance measurements obtained with WPI’s LWCC and Tidas S300 UV/VIS spectrophotometer are linear up to 1.4 AU. The measured absorbance can be converted to the spectral absorption coefficient α(λ), commonly used in oceanography for CDOM measurements. Absorbance and spectral absorption are related by the formula: α(λ) = 2.303 A (λ) / L, where 2.303 is the conversion factor from decimal to natural logarithmic, A (λ) is the absorbance at wavelength λ and L the LWCC pathlength.
Common applications of CDOM detection
- Determine the biogeochemical cycles, e.g. the organic carbon-based cycle in the ocean.
- Monitor and map of surface-water masses.
- Measure the UV light penetration into the ocean to determine:
- Photosynthesis reaction with effects on phytoplankton population
- Effect on oceanic food chains
- Atmospheric oxygen concentration
- Monitor the light absorption of CDOM as it relates to heat storage and the decline of sea ice.
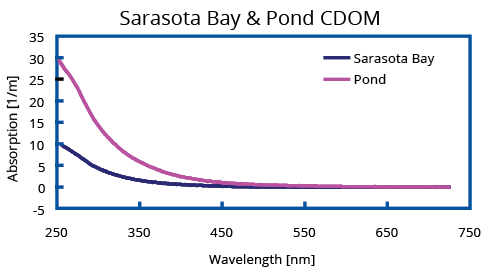
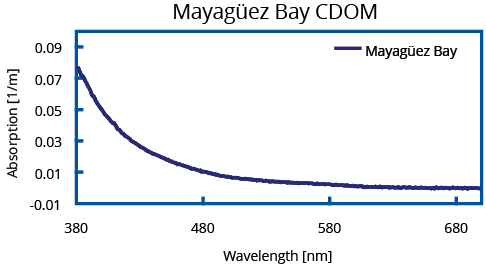
Two typical absorption spectra recorded with an UltraPath (UPUV) of a seawater and a fresh water sample collected in November 2007 are shown in the figures. Due to their high absorbance, both samples were analyzed in the 10 cm pathlength. The CDOM sample labeled Mayagüez Bay from oligotrophic, low productive waters with high salinity collected off the west coast of Puerto Rico in the Mayagüez Bay. Special attention should be drawn to the exceptional sensitivity of UltraPath enabling detection of CDOM absorption below 0.03 m-1. To exemplify the performance of the UltraPath in laboratory chemistry and process control, Ponceau S absorbance was measured with the 200 cm pathlength of an UltraPath. Normalizing the Ponceau absorbance graph to AU/cm, the range of this measurement is 150 μAU with a noise level below 2 μAU peak to peak. Sub-nanomolar concentration of this dye can clearly and reliably be detected, which is a novelty in absorbance based spectroscopy.


(Left) Two typical absorption spectra measured using UltraPath. The sample labeled “Sarasota Bay” is a CDOM sample with 34 PSU salinity collected from Sarasota Bay (Nov. 2007), and the sample labeled “Pond” is a highly concentrated CDOM sample collected from a local pond in Sarasota, Florida (Nov. 2007).
(Right) CDOM Sample “Mayagüez Bay” was collected from the high salinity oligotrophic waters of Mayagüez Bay on the west coast of Puerto Rico (2001). Data courtesy of NASA Stennis Space Center.


Request
Catalogue
Chat
Print